Stay informed with free updates
Simply sign up to the Global Economy myFT Digest — delivered directly to your inbox.
The “Japanification” of China continues to be a big theme, with a lot of eerie parallels right down to stimulus proving wanting. Here’s the latest symptom:
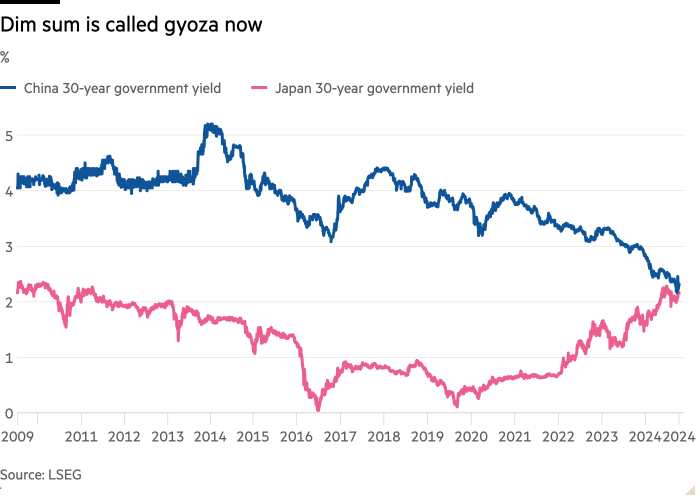
Yep, the 30-year government bond yields of China and Japan are on the cusp of crossing paths for the first time (ever, we think, but LSEG data for both 30-year benchmarks doesn’t go further back than 2009).
At pixel time there’s still a 8.7 basis point spread between the two long-term bond yields, with the Chinese 30-year yielding 2.245 and the Japanese 30s trading at 2.158 per cent. But it looks like that won’t last long. Shorting Chinese government bonds really has been the new widow-maker trade.
The fading yield curve differential is another stark manifestation of China’s growing economic and demographic malaise, and Japan’s (for now) success in finally winning a three-decade battle against deflation. As Barclays economists said in a big report on whether China can escape a similar fate:
China’s accelerated economic development was reminiscent of Japan’s postwar economic miracle. Moreover, China was in certain quarters once expected to overtake the US as the world’s largest economy by 2035.
However, after decades of rapidly narrowing the gap to the US, since 2022 China has started losing ground. Surpassing the US economy now appears a distant hope; its weakening labour market, declining firm profitability, slumping housing activity, and adverse debt-deflation dynamics have raised concerns about China’s longer-term growth outlook.
. . . We think China’s deleveraging journey has only just started, and it is unlikely to be completed before 2030, which implies the structural headwinds to consumption and investment will persist.
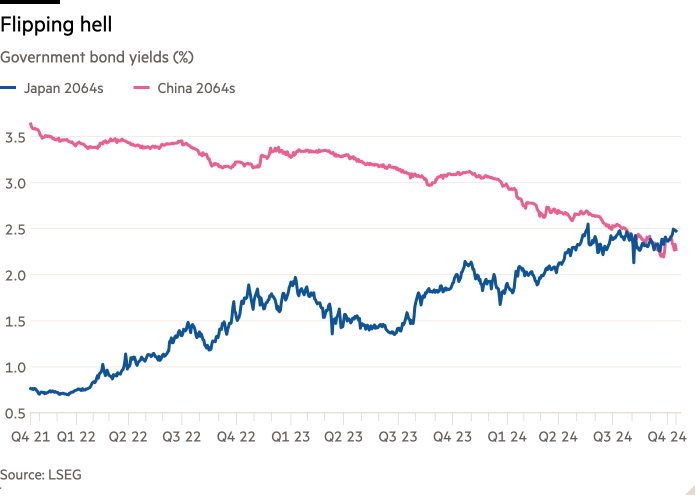
It should be noted that there’s still a decent-sized if narrowing gap between China and Japan on the 10-year part of the curve. But on the even longer end of the curve, yields have already crossed, with the Japanese government bond maturing in March 2064 currently yielding 2.472 per cent, and China’s November 2064 bond trading at 2.275 per cent.
The parallels between Japan in the early 1990s and China today are myriad, Barclays noted in its report. FT Alphaville’s emphasis below:
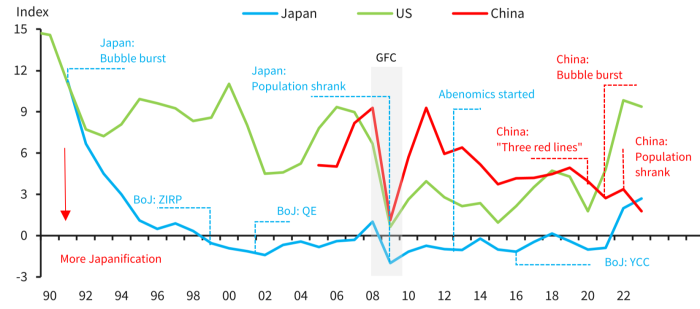
The economic circumstances facing China have parallels with Japan’s experience after its asset bubble burst in the early 1990s. This created the term ‘Japanification’, which is typically defined as a combination of slow growth, low inflation, and a low policy rate, accompanied by deteriorating demographic trends.
To measure this phenomena, a Japanese economist, Takatoshi Ito, introduced a Japanification Index, which measured the sum of the inflation rate, nominal policy rate, and GDP gap. To apply to China’s economy, we have adjusted this index, replacing the GDP gap with working-age population growth, as the estimation methods of GDP gaps differ across nations and working-age population is by far the most fundamental determinant for long-term growth. Our amended index shows that China’s economy has become more ‘Japanised’ than Japan’s recently, albeit marginally.
This not a surprise to us. A demographic drag, the emergence and collapse of asset bubbles, debt overhang, zombie companies, deflationary pressures from excess capacity/high debt, and high youth unemployment, to name a few, are some of the notable similarities between the economies of China and Japan post their bubbles.
And here’s that index.