
Receive free US economy updates
We’ll send you a myFT Daily Digest email rounding up the latest US economy news every morning.
This article is an on-site version of our Unhedged newsletter. Sign up here to get the newsletter sent straight to your inbox every weekday
Good morning. We’re back from Independence Day thoroughly stuffed with barbecue. With markets closed yesterday, Unhedged is bringing back an old friend: the economic prediction matrix. Many of you wrote in with thoughts on last year’s matrix, and we want to hear from you again. Write your predictions in the comments, on Twitter (@rbrtrmstrng) or by email: [email protected] and [email protected].
Back into the matrix
Last summer, we asked readers to predict where Federal Reserve policy and the economy would be in mid-year 2023, by placing probability estimates for the cells of this matrix:
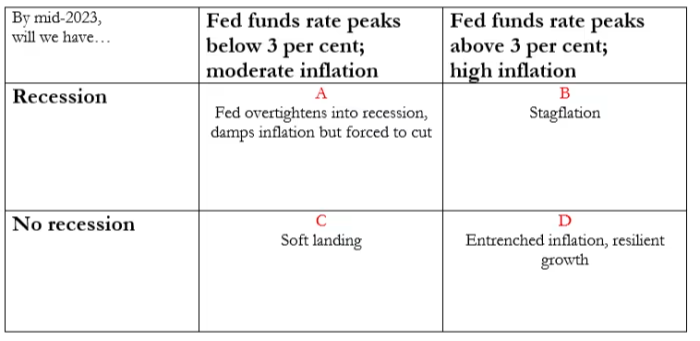
Readers saw a two-thirds chance of recession, while differing over the level of inflation:
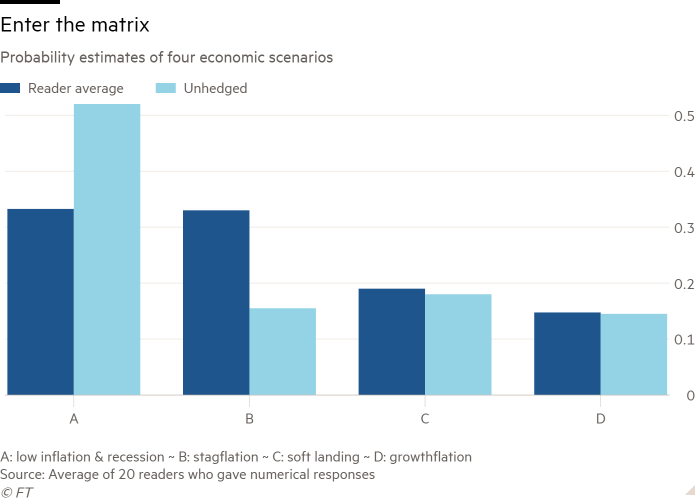
As you can see from the bar chart, Unhedged thought “A” (the Fed forcing the economy into recession before rates topped 3 per cent) was the most probable outcome. We wrote:
We figure that the Federal Reserve is dug in on bringing down inflation — but both growth and inflation are showing signs of peaking already. The Fed may push on an opening door, hard. Housing inflation will ease as wages continue moderating, and bloated inventories will prove disinflationary. Unfortunately that will spell a recession.
Contrary to our expectations, economic outcome has clearly been D. Growth is remarkably resilient and inflation, while it seems to have peaked, remains very high. Both Unhedged and its readers put the odds of this at under one in five.
What have we learned from this surprising turn of events? A couple of basic observations to start.
First, it is remarkable how far economic outcomes can diverge from consensus expectations. We picked 3 per cent as the fed funds rate over/under because it was market consensus. Now we are more than 5 per cent and (probably) rising. Most of us should take a moment to reflect on how far off we were. The most surprising thing, for Unhedged, is that so few things in the financial system have broken. If you told us a year ago that the Fed would be over five and the sum of the financial blow-ups was one midsized bank and a couple little ones, we’d have said you were nuts. When predicting economic outcomes, it is impossible to be too humble or too cautious. We’re all feeling around in the dark.
(Why does Unhedged like to make so many predictions, then? Not because we are particularly good at them, goodness knows. The point is that predictions force you to think carefully and make your assumptions explicit, and being proven wrong prevents you from breathing too much of your own exhaust. This is good for journalists and everyone else.)
Next, despite how much everything has changed, it is notable that the core question before investors remains exactly the same: can the economy come through a central bank tightening cycle without falling into recession?
Consider, then, this refreshed matrix, and place your bets:
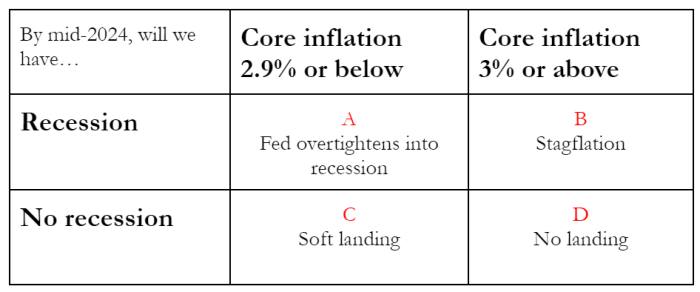
The puzzle here, as we see it, is how to balance evidence of a remarkably strong economy against the history of past rate-rising cycles and the accompanying inverted yield curves. First quarter 2023 real GDP was almost 2 per cent, estimates for second-quarter growth look similarly healthy, the housing market is resilient, consumer confidence is rising, the labour market is strong, and on and on. At the same time the yield curve is deeply inverted and for the past 60 years that has been a remarkably reliable recession indicator.
The solution to this puzzle may be a simple as timing. As Dominic White of Absolute Strategy Research pointed out to us, in the 10 recessions the 10-year/three-month yield curve has predicted since 1957 (without a false positive), the average period between the first inversion of the curve and the official start of recession has been nine months. The range runs from four months (the 1960-61 recession) to 16 months (2007-09). This time around, the curve first inverted last October 18, a little under nine months ago. History has more time to be right.
This is true of the stance of monetary policy, too. One way to measure it is by comparing the real fed funds rate to the estimated neutral rate, the policy rate that neither worsens inflation nor stifles growth. A real policy rate above the neutral rate should slow the economy. Relying on the New York Fed’s estimates of the neutral rate, policy has only been meaningfully tight since the fourth quarter of last year:
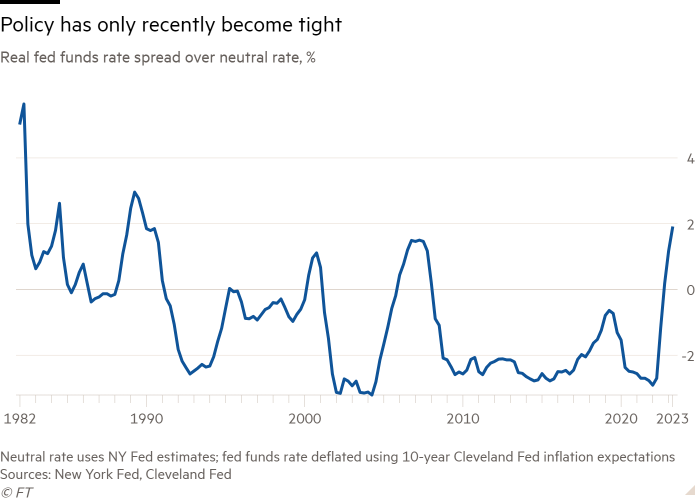
Hence our probability distribution:
A (recession and moderate inflation): 50 per cent. Still the most likely outcome because, historically, recessions tend to follow aggressive Fed tightening. But we have downgraded our estimate from last year to reflect the fact that this is clearly an unusual cycle and the economy appears strong.
B (recession and high inflation, or stagflation): 10 per cent. This is the lowest probability because we think a big chunk of current inflation is due to strong demand, which a recession would take care of in short order.
C (soft landing): 25 per cent. We’ve bumped this probability up from last year to acknowledge our surprise at how resilient the economy, especially the labour market, has been. If demand cools off a bit, the labour market loosens a bit and the Fed is not stubborn about getting all the way to 2.0 per cent, we see more room for a soft landing.
D (no landing): 15 per cent. We see this as an unstable equilibrium, because if high inflation persists, the Fed will just keep on tightening policy until growth collapses. In our view, no landing can only persist if monetary policy is a lot less impactful now, for some reason.
We await readers’ own distributions! Send them along!
An accompanying question for readers: for each outcome, what is the right asset class to own? Treasuries seem like a good bet for A; in C, a soft landing, we like small-cap stocks (more on this tomorrow). The others are harder. Send your ideas and we’ll write about them.
One good read
Ross Douthat on John Roberts, conservative elder statesman of a political Supreme Court.
FT Unhedged podcast
Can’t get enough of Unhedged? Listen to our new podcast, hosted by Ethan Wu and Katie Martin, for a 15-minute dive into the latest markets news and financial headlines, twice a week. Catch up on past editions of the newsletter here.
Recommended newsletters for you
Due Diligence — Top stories from the world of corporate finance. Sign up here
The Lex Newsletter — Lex is the FT’s incisive daily column on investment. Sign up for our newsletter on local and global trends from expert writers in four great financial centres. Sign up here