
This year’s bear market has been “epic” in depth and breadth. But aside from the mess in fixed income markets, it has also been remarkably orderly. Why has stock market volatility been so low?
It might not always be obvious, but in terms of both realised and implied volatility, the 2022 rout has been remarkably subdued. In other words, equity markets have deflated steadily like a balloon held in place, rather than a punctured one let loose to fly.
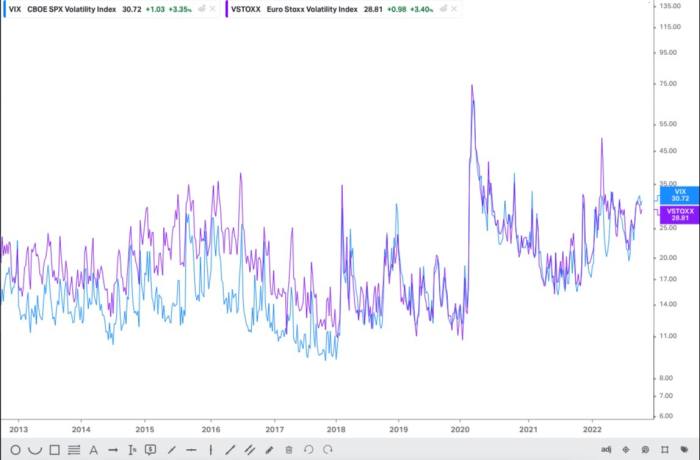
The Vix volatility index hasn’t breached the 40-point mark all year, and has generally oscillated around the 25-35 point mark it currently occupies. That’s not far above its long run average of about 20 points, despite the S&P 500 losing over a fifth of its value this year. Actual, realised volatility is even lower.
The European Vstoxx vol index did briefly go above the 50 mark back in March, after Russia invaded Ukraine. But it is now even lower than Vix, measuring 28.8 points at pixel. Both volatility indices are significantly higher than in the becalmed pre-Covid days, but are still low given the financial backdrop.
So what’s up with vol? Benn Eifert, the chief investment officer at volatility-focused hedge fund QVR Advisors, has a good explanation in his Q3 letter to investors. His emphasis in the block quote below.
In late 2021 and early 2022, institutional investors formed an unusual near-consensus view that central banks would raise interest rates and equities would fall. Hedge funds cut net and gross exposure dramatically. Asset owners moved to underweight positions in equities. Both initiated large hedges, leading to sharp moves higher in implied volatility and skew in late 2021. This widespread consensus turned out to be correct, and an extended trend lower ensued.
This relationship between consensus views, positioning, and market dynamics is essential to understand how this year has played out. Markets crash when fast money investors are caught long and leveraged, panic sell together, and trigger forced liquidations and unwinds of other leveraged positions . . .
. . . Market dynamics are entirely different when investors are bearish, underweight, and running record low levels of net and gross leverage. When dangerous pockets of extreme tail risk selling have already been nuked in prior episodes of market stress. Then there is no rapid de-risking, no extreme forced selling, no vicious spirals. Investors do not panic and lift thin offers on deep out-of-the-money put options on days when equities are down. If anything, they tend to sell out protection that they have already bought. As a result, risk assets can trend meaningfully lower over an extended period without any semblance of chaos.
This makes intuitive sense here at FTAV Towers. There are always some people caught unawares, but the central bank pivot from “it’s transitory” to “we’re going to nuke inflation” was petty well-telegraphed, and the impact widely expected. In fact, it seems more investors were wrongfooted by the strength of the rally in 2021 — as Eifert calls it, an “obviously silly market” — than there were when it eventually did unravel in 2022.
The massive financial shock caused by the Covid outbreak in 2020 also meant that many obvious vulnerabilities and faultlines have already been revealed, and vol-stirring excesses hadn’t had time to build up properly.
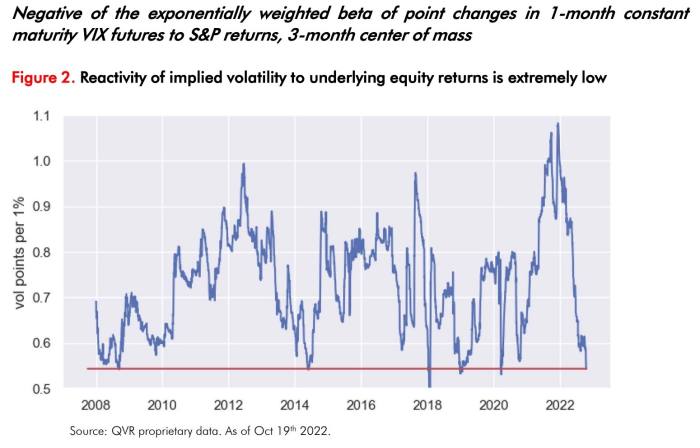
You can see the impact of the late-2021 de-risking in what Eifert calls ‘spot-volatility beta’ — the average reaction of implied volatility to changes in the underlying security prices — which has also collapsed this year.
But there are also some interesting, more nuanced technical factors behind the disconnect between volatility and the scale of the bear market, which we’ll quote in full to avoid mangling:
Low sensitivity of implied volatility to the prices of underlying assets translates into mediocre performance of out of-the-money (OTM) put options. A hedged OTM put option tends to make money if its implied volatility rises sharply as the underlying asset falls. Importantly, the implied volatility of a fixed strike option behaves differently than floating-strike implied volatility like that of a variance swap, volatility swap or VIX future.
If the volatility smile has its usual inverted slope (in traditional risky assets), as the underlying asset’s price falls, the strike of a 10% out of the money put option gets closer and closer to the spot price, and the option “slides down” the volatility smile. This means fixed-strike options experience a spot-volatility beta that is significantly lower than floating strike exposures.
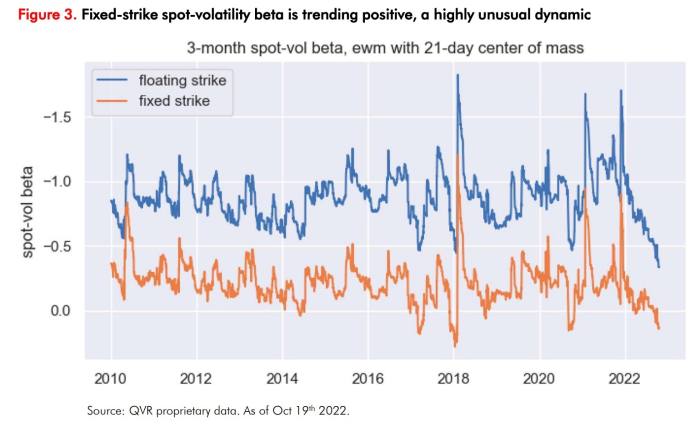
The orange line moving below zero is telling you that something is happening which only occurs very rarely historically: fixed strike implied volatility is falling on average on days when equity markets sell off and rising on days when markets rally. This means that managers who have been holding downside put options on a Black-Scholes delta hedge — following the standard Nobel Prize winning work that defines traditional option theory — are losing money as markets fall. This contributes to the popular perception that hedges are not working.
Eifert reckons this regime of “choppy downside” could go on for a while yet, as the massive retail-investing boom has yet to reverse fully, and as institutions may face a round of capital calls from private market funds they signed up to during the boom.