
A new computational method developed by researchers at the University of Oxford and Imperial College London uses an innovative new technique to track down the sources of river pollutants. The method can work backwards from observations of polluted river water—making it a simple approach that could be scaled up nationwide.
In a case study, the model identified the source of a harmful neonicotinoid pesticide—banned for agricultural use- in a rare chalk stream habitat. Oxford researchers have also developed www.sewagemap.co.uk, a popular tool widely used by members of the public to identify sewage-polluted rivers in real time.
Recent months have seen national outcry over water companies allowing sewage pollution in rivers to breach acceptable limits. Combined with pollution from agricultural fertilizers and chemicals, this has led to only 14% of rivers in England currently meeting ‘good’ ecological status. But to date, there has been no robust method to identify the likely sources of river pollution, making it almost impossible to effectively address the problem.
A research study co-authored by scientists at the University of Oxford now provides a new approach. This utilizes “inverse modeling,” which works backwards from observations of pollution in rivers, tracing them back to the probable source. The paper is published in the journal Science of The Total Environment.
This is in contrast to current ‘forward modeling’ methods, which start from an assumed set of pollution sources and run forwards to estimate the eventual distribution and reach of the pollutants. However, this has several critical flaws—namely, that the potential sources need to be known in advance, and it is often based on large assumptions and uncertain data.
Study co-lead Dr. Alex Lipp (Department of Earth Sciences & Merton College, University of Oxford) said, “The first step to mitigating a polluted river is working out where the problem is. These new mathematical ‘inverse’ methods provide an objective way to determine where and how pollutants enter river networks from monitoring data alone.”
The new technique was tested on the River Wandle, a chalk stream in southwest London which has prompted local outrage over recent sewage dumping. Recently, the neonicotinoid pesticide imidacloprid was detected in the river Wandle despite it being illegal to use on fields in the UK since 2018.
Using the new inverse modeling, the researchers concluded that, overwhelmingly, the imidacloprid in the River Wandle comes from one small part of the river that contains the out-flow of a sewage treatment works.
Co-lead author Dr. Gareth Roberts (Department of Earth Science & Engineering, Imperial College London) said, “This supports the idea that imidacloprid in our rivers can originate from its use as pet medication, entering sewage systems after being washed down drains and evading removal at wastewater treatment facilities.”
Citizens called on to become ‘river wardens’
Having demonstrated the power of the inverse-modeling approach, Dr. Lipp is keen to see it scaled up and ultimately become a key part of the future of water quality monitoring.
“One application of this approach I’m very interested in is the analysis of citizen science data” Dr. Lipp added. “Citizen campaign groups are now frequently generating fantastic high-density datasets of pollutants such as phosphorous and nitrate in rivers, and this inverse approach could be used to turn this data into actionable insights.”
Citizen data has already been used as part of the national river campaigns. For instance, water quality testing by River Action citizen scientists found high levels of E.coli bacteria along the River Thames ahead of the Henley Royal Regatta. This new modeling approach could equip volunteer ‘river guardians’ to take more targeted actions against polluters.
CEO of River Action James Wallace said, “Repeat offenders like the water companies and industrial-scale agriculture often try to pass the buck, blaming others for the muck they allow to freely enter our rivers. But modeling approaches such as this new algorithm could ultimately empower a legion of citizen scientists up and down the UK to pin-point sources of pollution, leaving the perpetrators nowhere to hide.”
“The potential of new methods and citizen science must now be further explored by the Environment Agency in their prosecutions of polluters and subsequent penalties, matched by proper government funding in the upcoming Budget to empower the regulator to enforce the law. Improving the power of pollution monitoring sends a powerful message—pollute at your peril and not for profit.”
Making a difference with data
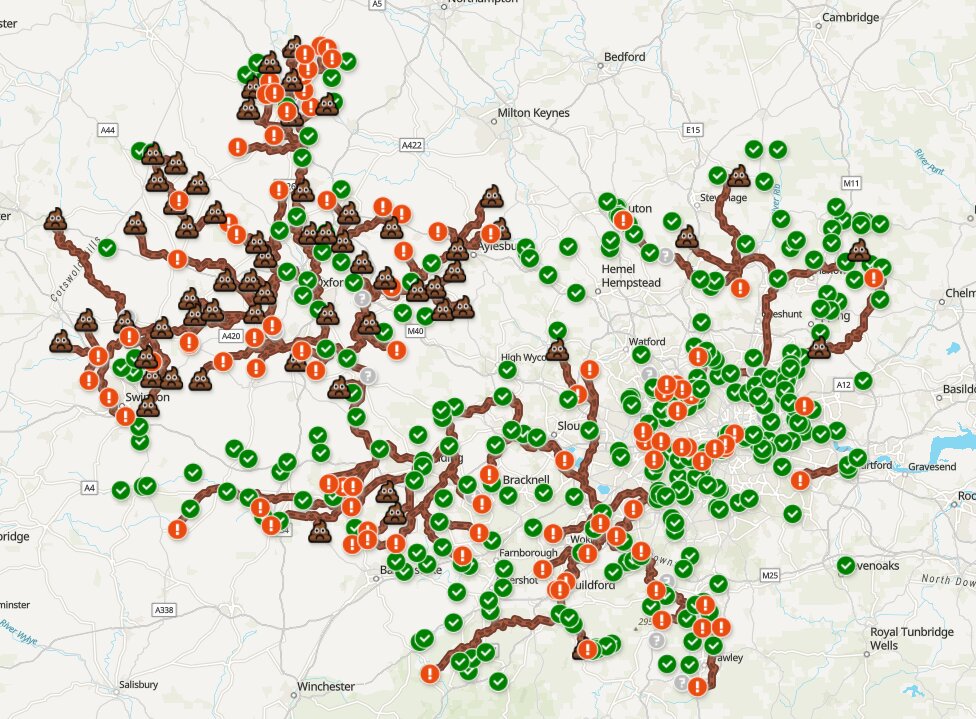
The new study builds on Dr. Lipp’s data-driven approach to tackling the ‘river crisis.” In 2023, with his collaborator Jonathan Dawe, at the British Antarctic Survey, he developed www.sewagemap.co.uk, a free, open-source website which shows real-time information about river sections that might be affected by untreated sewage discharges in the Thames Basin.
This is done using a model which links real-time sewage outflows to the downstream sections of the river. The website is already popular with wild swimming groups, and citizen scientists, who use it to identify local rivers that are being polluted with sewage in real-time.
Jeremy Watson, an outdoor swimmer in London who uses SewageMap regularly said, “With SewageMap, it is easy to get a reasonable estimate of the state of sewage in a river at a particular spot for the day you want to swim. For instance, I checked it after a sunny week, and it showed only one spill, 90km upstream, so I went for a nice swim near Hampton Court Palace.
“When I looked again after a couple of wet days it showed there were suddenly dozens of upstream sewage spills—so I went to the pool instead! It’s a great privilege to find something which goes so far in meeting a public need for presenting information in a very accessible way. For me, it is also great to see that the software is made openly available by a team with the energy and enthusiasm to welcome new contributors.”
The model underlying Sewage Map is based on public data released by Thames Water on sewage discharges. Because no other water companies make this information accessible at present, the model can’t yet be scaled up to the rest of the UK. Dr. Lipp concluded, “This is why it is so important that water companies follow the lead of Thames Water, releasing environmental data in an accessible format for the public, and scientists, to use.”
The case study on the River Wandle, “Using convex optimization to efficiently apportion tracer and pollutant sources from point concentration observations,” has been published in Water Resources Research.
More information:
Kajetan Chrapkiewicz et al, Apportioning sources of chemicals of emerging concern along an urban river with inverse modelling, Science of The Total Environment (2024). DOI: 10.1016/j.scitotenv.2024.172827
Richard Barnes et al, Using Convex Optimization to Efficiently Apportion Tracer and Pollutant Sources From Point Concentration Observations, Water Resources Research (2024). DOI: 10.1029/2023WR036159
Provided by
University of Oxford
Citation:
Computational method works backwards from observations to track down river polluters (2024, October 17)
retrieved 17 October 2024
from https://phys.org/news/2024-10-method-track-river-polluters.html
This document is subject to copyright. Apart from any fair dealing for the purpose of private study or research, no
part may be reproduced without the written permission. The content is provided for information purposes only.