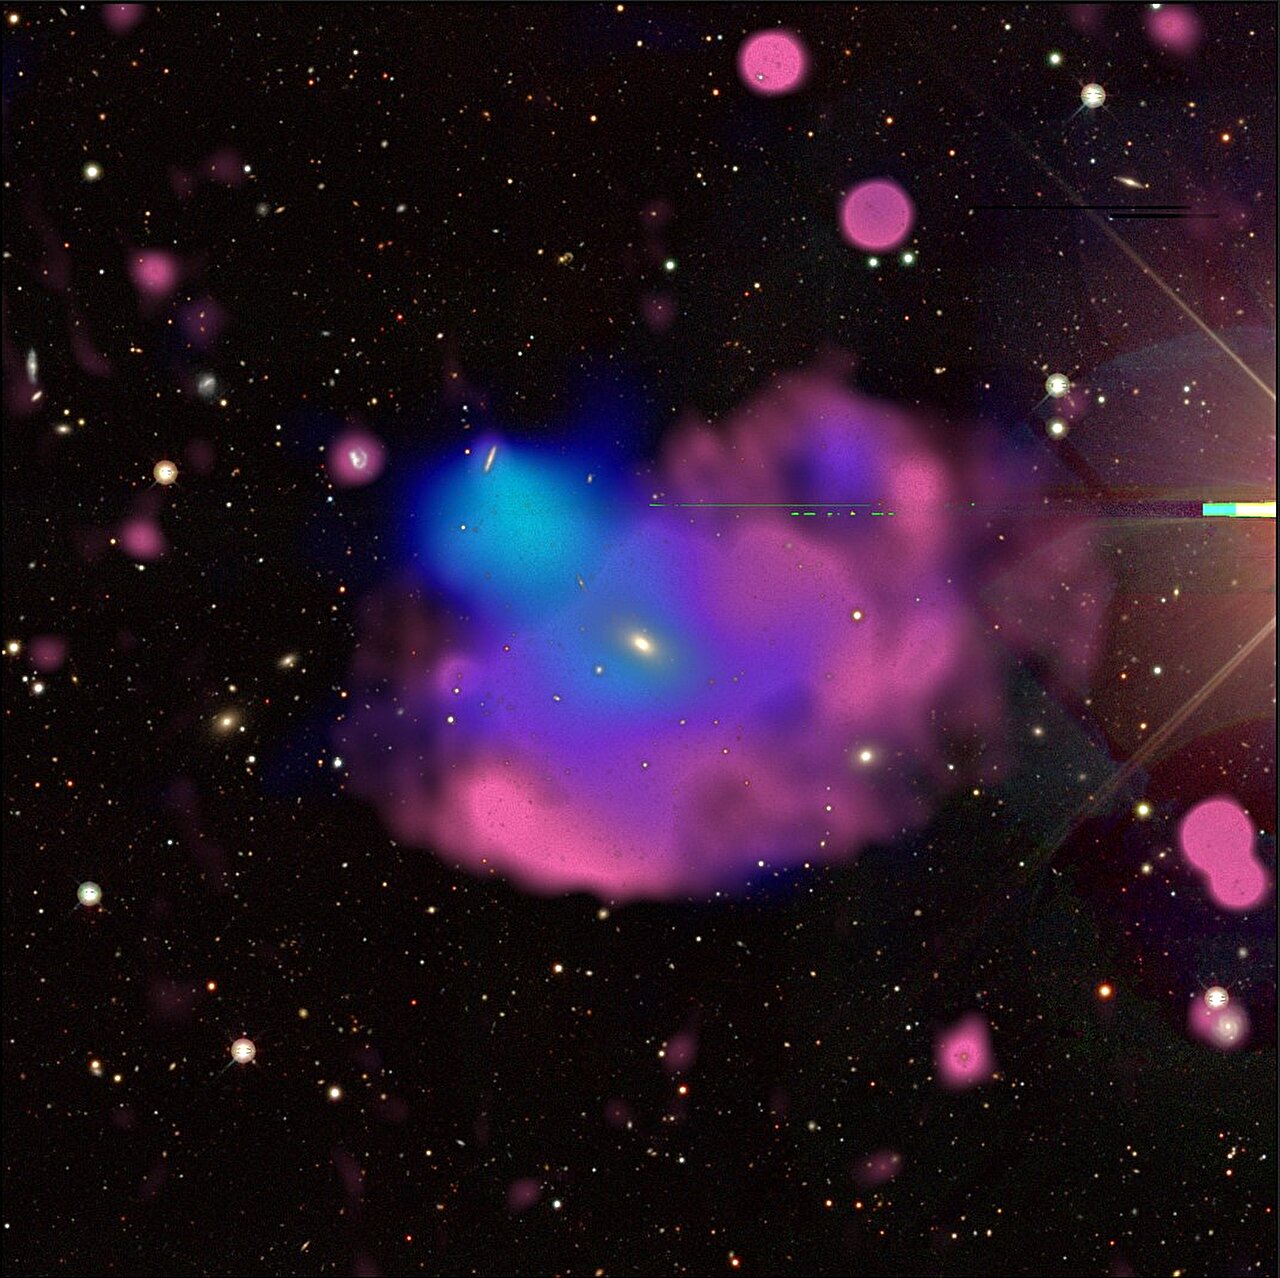
 combines visible light observations from the DESI (Dark Energy Spectroscopic Instrument) Legacy Survey in white and yellow, X-rays from XMM-Newton in blue, and radio from ASKAP (the Australian Square Kilometer Array Pathfinder) in red. Credit: X. Zhang and M. Kluge (MPE), B. Koribalski (CSIRO)")
An atlas doesn’t seem to be an essential item in cars these days, but think about them and most people will think about distances. An atlas of the stars not only covers distances but must also take into account time too. The Andromeda galaxy, for example, is so far away that its light takes 2.5 million years to reach us.
A team of researchers have now built a catalog that contains information on millions of galaxies including their distance and looks back in time up to 10 billion years.
Like anything that has lots of stuff, there are always catalogs to capture information about them. Astronomy is no different and there are plenty of catalogs; Messier, New General, Second Cambridge Catalogue of Radio Sources and the Two Micron All Sky Survey, the list goes on.
Now a new catalog has been created to provide information on millions of distant galaxies. It was created by a collaboration of organizations led by the Institute of Space Sciences as a result of the Physics of the Accelerating Universe Survey (PAUS.)
Over a period of 200 nights between 2015 and 2019, the teams embarked on their survey using the PAUCAM mounted upon the William Herschel Telescope (WHT) in La Palma. The camera is mounted at the prime focus of the WHT giving it a whopping 1 degree field of view. There are filter trays in front of the CCDs with 42 narrowband filters ranging from 4400 to 8600 angstroms.
The team used different filters to image the same field numerous times. The light from more distant objects will be shifted toward the red end of the spectrum and the multiple images of the same field will enable distance calculations to be made.
Overall, the survey covers 50 square degrees of the sky. To put that into context, the full moon measures half a degree across, so the full survey maps out an area of sky equivalent to about 250 full moons. Having analyzed the full set of images, the catalog that has been developed includes data for 1.8 million objects which will be the foundations for astronomers to better understand the structure of the universe.
Understanding the structure of the universe is to understand the distribution of dark matter and dark energy. Dark energy is thought to make up 70% of the universe but we still don’t know what it is. We can see its effect in the accelerated expansion of the universe but its nature remains a mystery to us. The new survey will help to shine a light on dark energy with its comprehensive data set of galaxies that span more than 10 billion light years.
The results are a significant step forward in research into the cosmic distance scale and offers an extensive catalog of photometric redshift measurements as they appeared billions of years ago. Over the months that follow, the team are planning on exploring galaxy clustering and galaxy shapes to help understand the evolution of the universe.
Provided by
Universe Today
Citation:
A new catalog charts the evolution of the universe over time (2024, September 23)
retrieved 23 September 2024
from https://phys.org/news/2024-09-evolution-universe.html
This document is subject to copyright. Apart from any fair dealing for the purpose of private study or research, no
part may be reproduced without the written permission. The content is provided for information purposes only.