Trend-following hedge funds have suffered one of their worst monthly losses since the dotcom bust in the bond market turmoil that was unleashed by the recent banking crisis.
So-called CTA funds, which manage about $200bn in assets, according to eVestment, use algorithms to detect and ride trends in global futures markets, but many were caught out by a sudden reversal in US Treasuries after Silicon Valley Bank’s failure.
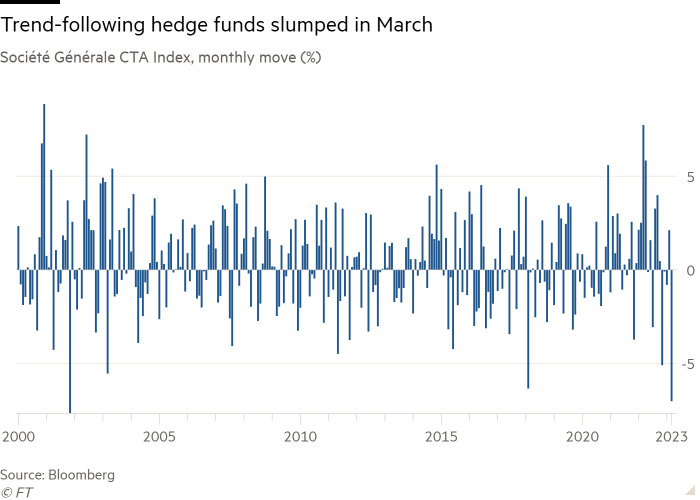
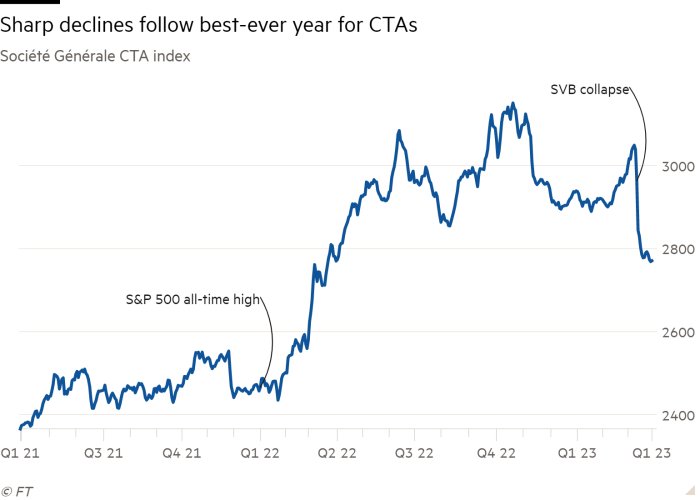
Société Générale’s CTA index, which tracks the performance of 20 of the largest such funds, dropped 6 per cent in the space of two days in the wake of the Californian lender’s collapse, and has slid further since. It declined 6.4 per cent in the month to March 30, the latest day for which data was available.
That would mark its worst monthly performance since November 2001, another month when changing interest rate expectations caused historic swings in Treasury yields.

The trend-following funds had profited from last year’s historic sell-off in bond markets, but many came unstuck when the banking chaos prompted a sudden dash into ultra-safe US government debt.
“CTAs were following last year’s trend into this year,” said Edward Al-Hussainy, a senior analyst at Columbia Threadneedle. “When trends reverse as rapidly as they did in the banking crisis, CTAs are bound to get caught offside. It was particularly bad because of how crowded they were in the short positions in Treasuries.”
Funds managed by firms including Man Group, Aspect Capital and Systematica Investments were among those hit by the moves.
Speculators in February had held the largest collective bet against short-dated US government debt on record, according to Commodity Futures Trading Commission data going back to 1993. And CTAs had been running bets against the two-year Treasury for well over a year, according to Société Générale’s Trend Indicator, which models these vehicles’ positions.
The rush into Treasuries disrupted the trade, forcing hedge funds to buy bonds in order to exit their losing positions.

The sudden shift in hedge fund positioning helped fuel some of the biggest moves in the Treasury market since the 1980s, and drove volatility to its highest level since 2008.
CTA strategies are often pitched to investors as a way to diversify away from other assets. The SG index enjoyed its best-ever year in 2022, climbing almost 20 per cent while the S&P 500 dropped almost 20 per cent.
Ron Lagnado, research director at Universa Investments, said the way CTAs’ algorithms picked up signals meant they performed well during slow corrections like last year’s but could struggle when markets were more “choppy”.
“A perfect storm allowed [CTAs] to capitalise on what happened in 2022 . . . [but] these sudden declines were not being telegraphed.”

